

YouTube Analytics Explained: The Metrics Behind Channel Growth
YouTube Analytics is where creators move beyond checking views and start understanding what viewers actually do. The YouTube analytics metrics inside Studio can show whether people saw a video, chose it, kept watching, returned later, or subscribed. That makes YouTube channel analytics much more useful than treating one number as the final verdict.
This YouTube Analytics for beginners guide explains the main reports in plain English and shows how the numbers connect. A video can have a strong YouTube click-through rate and still struggle if viewers leave quickly. Another may get fewer YouTube impressions but hold attention for much longer.
The useful skill is learning how to use YouTube Analytics as a chain: reach, choice, consumption, retention, discovery, loyalty, and conversion.
What Is YouTube Analytics?
YouTube Analytics is YouTube Studio’s reporting system for understanding content reach, viewing behaviour, watch time, retention, traffic sources, audience activity, and revenue where eligible. It helps creators compare content, identify patterns, and understand channel performance without relying on one metric alone.
Understanding the YouTube Analytics Dashboard
The YouTube Analytics dashboard sits inside YouTube Studio Analytics. On desktop, creators can open YouTube Studio and select Analytics.
YouTube has been gradually rolling out an updated Studio experience since July 2026, so the YouTube analytics dashboard may not look identical for every creator. The main reporting areas still cover Overview, Content, Reach, Engagement, Audience, Revenue, Trends, and deeper reporting through Advanced Mode.
Official YouTube Analytics overview
| Analytics Area | What a Beginner Should Look For |
| Overview | Quick channel and content snapshot |
| Content | Performance by content type |
| Reach | Impressions, CTR, discovery |
| Engagement | Watch time, duration, retention |
| Audience | Viewer behaviour and loyalty |
| Revenue | Monetisation data for eligible creators |
| Trends | Audience interests and content opportunities |
The YouTube Analytics Content tab helps compare long-form videos, Shorts, live content, posts, playlists, and podcasts where available. YouTube Content analytics is useful because different formats often behave differently. The YouTube Analytics Reach tab focuses on discovery, while the YouTube Analytics Engagement tab focuses more on viewing behaviour.
For somebody learning how to read YouTube Analytics, the dashboard is not a scorecard. Each section answers a different question about YouTube channel performance.
What Do Views and Engaged Views Mean?
YouTube changed view reporting on August 24, 2026. YouTube views are now counted when a video starts to play across Shorts, long-form videos, and live streams. That means older explanations of how YouTube counts views may no longer match the current YouTube views metric.
YouTube engaged views are different. YouTube still uses engaged or qualified measures in some Shorts, monetisation, and eligibility contexts.
That distinction matters because YouTube video views and YouTube engaged views should not be treated as the same metric. Shorts views analytics can show broad viewing activity, while Shorts engaged views help describe viewers who stayed beyond the immediate start.
The YouTube view count is useful for reach and consumption, but it becomes more meaningful beside retention and traffic-source data.
What Do Impressions Mean on YouTube?
YouTube impressions measure how many times a registered thumbnail was shown to viewers on YouTube.
YouTube thumbnail impressions do not represent every possible appearance of your content. External websites, some notifications, and other surfaces do not necessarily behave like counted impressions.
The YouTube impressions metric helps answer a simple question: was the thumbnail given a chance to be seen?
YouTube video impressions can rise while CTR falls. That can happen when a video expands beyond its core audience. YouTube itself warns creators to consider impressions and CTR together rather than judging either number in isolation.
YouTube’s official impressions and CTR guidance
That is why YouTube reach metrics need context. If you are asking what do impressions mean on YouTube, think of them as opportunities to be seen rather than guaranteed views.
What Is YouTube Impressions Click-Through Rate?
YouTube impressions click-through rate measures how often registered thumbnail impressions resulted in viewers choosing to watch.
YouTube CTR is therefore a packaging metric. It can help you judge whether the topic, title, and thumbnail are attracting interest, but there is no universal “good” YouTube CTR.
YouTube click-through rate can vary according to traffic source, audience size, topic, competition, distribution, and viewer familiarity. A YouTube thumbnail CTR may be high with loyal viewers and then drop when a video reaches a broader audience.
The practical YouTube CTR meaning is simple: how often people watched after seeing an eligible impression.
That makes YouTube CTR analytics more useful when paired with YouTube impressions click-through rate, viewing duration, and traffic sources.
If you are asking what does CTR mean on YouTube, avoid turning one percentage into a pass-or-fail score.
Why Watch Time Matters
YouTube watch time is the total amount of time viewers spend watching your content.
The YouTube watch time metric helps explain how much viewing a video or channel generated. YouTube watch time hours can rise because more people watched, because viewers stayed longer, or both.
YouTube channel watch time is therefore useful for understanding total consumption, but it does not explain everything by itself.
If you are asking what is watch time in YouTube Analytics, the key is to read it beside average duration, percentage viewed, and retention.
The goal is not simply to increase YouTube watch time. It is to understand whether the content keeps the people it reaches.
Average View Duration vs Average Percentage Viewed
 YouTube average view duration tells you the average amount of time watched per relevant view under YouTube’s reporting methodology. YouTube currently calculates average view duration using engaged views and corresponding watch time.
For example, if viewers collectively watch 500 minutes across 100 relevant views, average view duration YouTube reporting would be about five minutes.
| Metric | What It Helps You Understand |
| Average View Duration | Average time watched |
| Average Percentage Viewed | Average portion of the video watched |
YouTube AVD measures time, while YouTube average percentage viewed helps put that time into context against video length.
A five-minute average watch duration looks very different on a six-minute video compared with a 30-minute video. That is why average percentage viewed YouTube data can be useful when comparing content of different lengths.
YouTube percentage watched and YouTube APV still need context. There is no universal percentage that guarantees strong YouTube video performance.
How to Read YouTube Audience Retention
YouTube audience retention shows how viewing changes across the timeline of a video.
The YouTube retention graph can reveal early drop-offs, stable stretches, spikes, dips, and moments that viewers replay.
A dip in YouTube video retention may mean viewers skipped that section or stopped watching. A spike can mean people rewatched a moment, shared it, or jumped directly to it. YouTube warns that context is still needed before deciding why a movement happened.
YouTube’s key moments for audience retention guide
The YouTube audience retention graph is especially useful when similar patterns appear across several uploads. YouTube key moments for audience retention may also highlight intros, top moments, spikes, and dips.
YouTube retention is therefore not one pass-or-fail percentage.
If you are asking what does audience retention mean on YouTube, think of it as a map showing where viewer attention held and where it changed.
How Viewers Find Your Videos
YouTube traffic sources explain how viewers arrived at your content.
Common sources include:
- YouTube Browse features
- YouTube Suggested Videos
- YouTube Search traffic
- Shorts Feed
- channel pages
- YouTube external traffic
YouTube traffic source analytics matters because viewer behaviour can differ by source. Somebody deliberately using Search may behave differently from somebody who encountered a video on Home.
That is why how viewers find your videos should be checked before comparing CTR or retention too aggressively.
YouTube Search traffic may be driven by a specific question. YouTube Suggested Videos may bring viewers from closely related videos. YouTube Browse features can expose content to a wider mixture of people.
If you are asking how do I find YouTube traffic sources, open the relevant Content or Reach report and review the traffic-source breakdown.
Understanding Your Audience
YouTube audience analytics answers a different question: who is actually watching, and who is coming back?
YouTube unique viewers estimates how many distinct viewers watched within the selected date range. YouTube monthly audience measures the total unique viewers who watched during the previous 28 days and is designed to help creators understand active audience size.
Official YouTube Audience analytics guide
YouTube audience metrics also include subscriber activity, new viewers, casual viewers, regular viewers, and returning behaviour.
That makes YouTube viewer analytics more useful than treating subscriber count as the only measure of audience health.
YouTube subscriber analytics can show YouTube subscribers gained and broader YouTube subscriber growth, but the YouTube subscribers metric should be compared with YouTube unique viewers and YouTube monthly audience.
New, Casual and Regular Viewers Explained
YouTube new viewers are people who watched your channel for the first time during the selected period.
YouTube casual viewers have watched before and return occasionally.
YouTube regular viewers have watched the channel consistently for a longer period. YouTube currently defines regular viewers as people who watched at least once per month for more than six months during the previous year.
These groups help explain new vs returning viewers YouTube behaviour.
A channel can benefit from discovery and loyalty at the same time. YouTube new viewers expand reach, while regular and returning audiences show whether people continue watching.
YouTube returning viewers are people who have previously watched the channel and came back during the selected period. Returning viewers YouTube Analytics can therefore add useful context to YouTube audience growth.
The YouTube new vs returning viewers picture should be treated as a balance. YouTube repeat viewers matter, but attracting new people also matters.
Which YouTube Analytics Metrics Matter for Shorts?
 YouTube Shorts analytics should be read separately from long-form reporting.
Important YouTube Shorts metrics can include:
- views
- Shorts engaged views
- Shorts shown in feed
- likes
- subscriber activity
- stayed to watch
- swiped away
YouTube stayed to watch indicates the share of times viewers chose to view rather than immediately swipe away. YouTube swiped away represents the other side of that choice. Shorts viewed vs swiped away is therefore an early choice signal rather than the same thing as complete YouTube Shorts retention.
Shorts chose to view helps describe whether the opening stopped the swipe. After that, YouTube Shorts performance still needs to be judged using viewing behaviour.
For creators asking what metrics matter for YouTube Shorts, start with Shorts shown in feed, YouTube stayed to watch, Shorts engaged views, and retention.
YouTube Shorts analytics becomes much more useful when those signals are read together rather than forcing long-form YouTube thumbnail CTR logic onto Shorts.
Engagement and Realtime Analytics
YouTube engagement metrics such as likes and comments add context, but they should not automatically be treated as stronger than viewing behaviour.
YouTube likes analytics and YouTube comments analytics can show how people responded. A YouTube engagement rate can also be useful if you define it consistently for your own comparisons.
The YouTube Analytics Engagement tab includes YouTube watch time analytics, average duration, and retention-related information. YouTube engagement analytics helps explain what happened after the viewer chose the content.
YouTube realtime analytics serves a different purpose.
Current reporting can compare YouTube 60 minute views and YouTube 48 hour views. YouTube realtime views are useful for checking early movement after publication, but they are not a final judgement of lifetime performance.
Use YouTube latest video analytics as an early pulse, then return later when more data is available.
What Is the Trends Tab?
The YouTube Analytics Trends tab helps creators explore what audiences are watching and identify possible topic opportunities.
YouTube Trends analytics can surface search interest and YouTube content gaps where available.
YouTube audience trends can help with idea development, but a trend is not a prediction. A topic appearing in Trends does not guarantee that your version will perform.
Revenue Analytics
YouTube revenue analytics is mainly relevant to eligible monetising creators.
The YouTube Revenue tab can include YouTube estimated revenue and related monetisation reporting. Metrics such as YouTube RPM and YouTube CPM answer different revenue questions, but revenue is only one part of the broader analytics picture.
For eligibility and monetisation details, see HiSellIt’s YouTube Partner Program Explained.
Creators using fan-funding features can also read the YouTube Channel Memberships guide for more context.
What Can You Do in Advanced Mode?
YouTube Analytics Advanced Mode gives creators deeper reporting, comparisons, filters, breakdowns, saved reports, and data exports.
YouTube advanced analytics can compare specific videos, groups, time periods, traffic sources, geographies, and subscription status. You can also compare YouTube videos analytics side by side.
YouTube analytics reports can be customized, and creators can export YouTube Analytics data from the expanded report. YouTube currently supports exporting the current view and comparing videos or groups directly.
Official YouTube Advanced Mode guide
For a beginner, YouTube Analytics Advanced Mode is most useful when you have a clear question to answer, rather than opening every possible report.
Which YouTube Metrics Matter Most for Channel Growth?
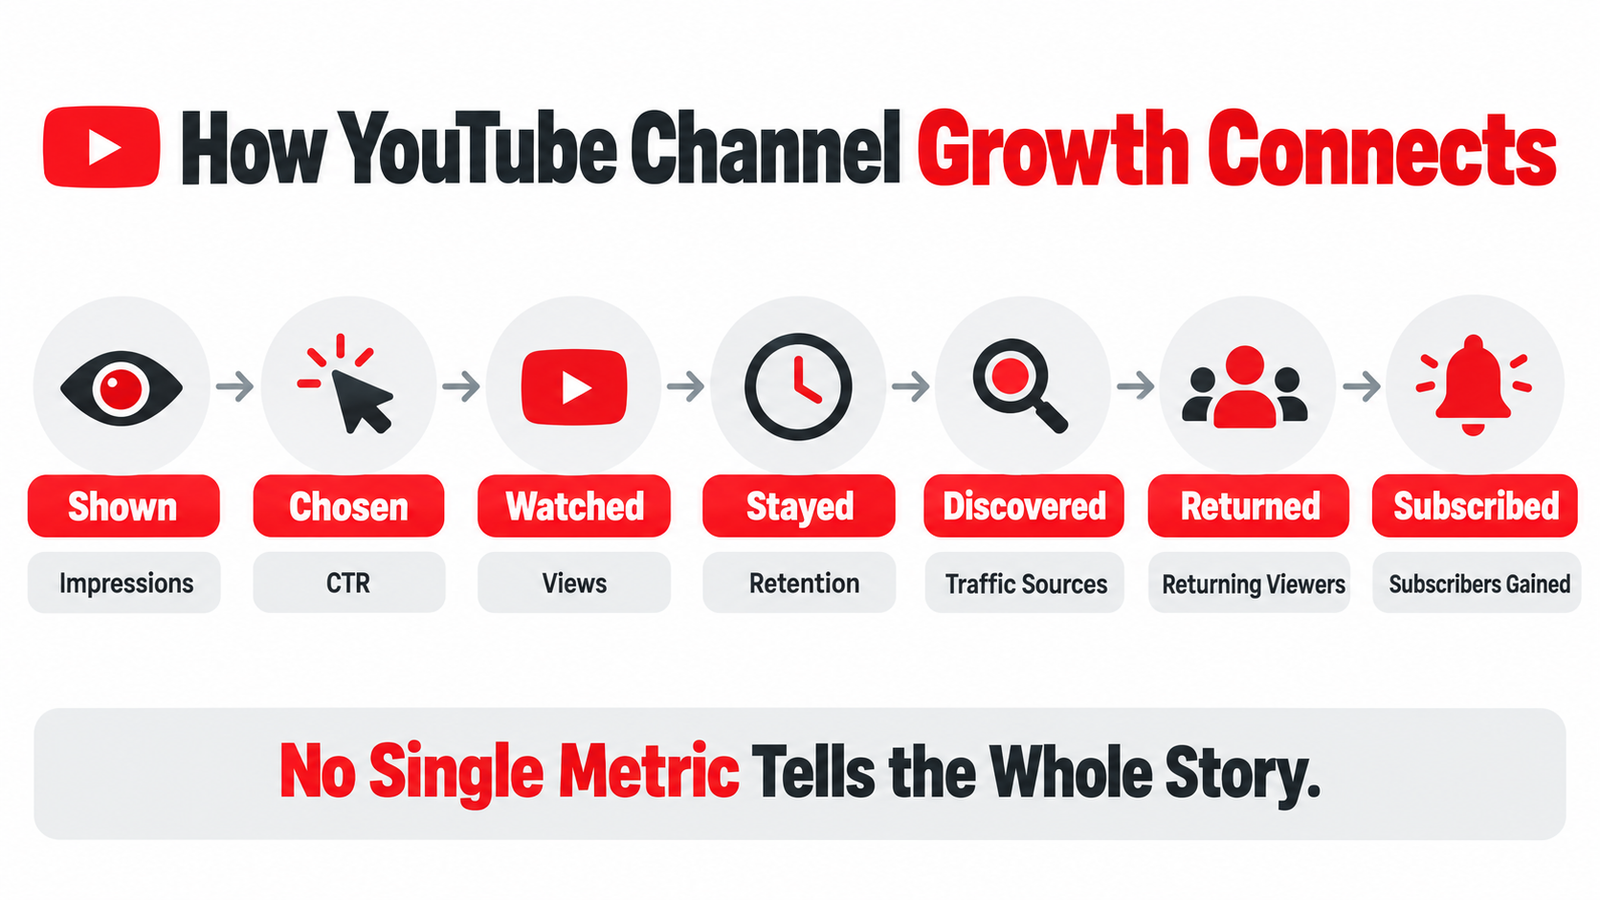 There is no single metric that defines YouTube channel growth.
YouTube itself says there is no universal most-important metric or universal “good” benchmark for measures such as CTR. Creators should compare performance against their own history and goals.
| Growth Question | Metrics to Check |
| Are people seeing the content? | Impressions / feed exposure |
| Are they choosing it? | CTR / stayed to watch |
| Are they consuming it? | Views / engaged views |
| Are they staying? | Watch time / AVD / retention |
| How did they find it? | Traffic sources |
| Are they coming back? | Returning / regular viewers |
| Are they converting? | Subscribers gained |
This is the useful framework for YouTube growth metrics.
Reach
Check impressions or feed exposure.
Choice
Use CTR for eligible thumbnail impressions or stayed-to-watch behaviour for Shorts.
Consumption
Look at views and engaged views.
Viewing Quality
Use YouTube average view duration, percentage viewed, and YouTube audience retention.
Discovery
Review YouTube traffic sources.
Audience Loyalty
Compare new, casual, regular, and returning viewers.
Conversion
Check YouTube subscriber growth and subscribers gained.
The most useful metrics for YouTube growth therefore depend on the question being asked.
YouTube channel performance metrics tell different parts of the same story. To measure YouTube channel growth, compare several uploads and longer time periods rather than reacting to one day’s data.
YouTube growth analytics becomes far more useful when reach, viewing quality, discovery, audience behaviour, and conversion are connected.
That is the simplest answer to how do you measure YouTube channel growth: follow the chain rather than hunting for one magic number.
YouTube Metrics You Should Not Read in Isolation
Good interpreting YouTube Analytics starts with combinations.
High Impressions + Low CTR
The packaging may need attention, but traffic source and audience breadth still matter.
High CTR + Weak Retention
The title and thumbnail may earn the click, but the content may not fully satisfy the expectation created before the click.
Strong Retention + Low Impressions
The video may work well for the people seeing it while still having limited distribution.
High Views + Few Returning Viewers
Discovery may be growing faster than audience loyalty.
High Subscriber Count + Low Monthly Audience
A large historical subscriber total does not necessarily mean the current active audience is equally large.
These are interpretation patterns, not algorithm formulas.
YouTube metrics explained responsibly means avoiding the common YouTube analytics mistakes of turning correlations into guaranteed rules.
Common Beginner Analytics Mistakes
For YouTube metrics for beginners, avoid:
- checking views only
- obsessing over one CTR percentage
- comparing Shorts directly with long-form
- ignoring traffic-source context
- assuming every retention dip is automatically bad
- confusing subscribers with active audience
- judging a new upload only from its first hour
- comparing videos without considering topic or length
A good YouTube analytics beginner guide should help you ask better questions, not give you artificial benchmarks.
Conclusion
YouTube Analytics explained properly is less about finding one perfect number and more about understanding how YouTube analytics metrics connect.
For YouTube channel growth, think in this order:
reach → click or view choice → consumption → retention → discovery → returning audience → subscriber conversion
No single metric tells the whole story.
If you are learning how to read YouTube Analytics, start with a small set of YouTube channel metrics after each upload and compare them across several videos and longer periods. Patterns across multiple uploads are usually more useful than reacting to one number from one day.
For creators building a larger publishing workflow, HiSellIt’s YouTube Automation services can provide additional operational support once you understand which performance signals actually matter.
Frequently Asked Questions
Q. How Does YouTube Analytics Work?
It collects channel and content performance data and organizes it into reports covering reach, viewing behaviour, audience, discovery, engagement, and revenue where applicable. Creators can use those reports to compare content and identify patterns over time.
Q. What Metrics Matter Most on YouTube?
Start with impressions or feed exposure, CTR or stayed to watch, views, watch time, retention, traffic sources, returning viewers, and subscribers gained. The exact combination depends on whether you publish long-form videos, Shorts, live content, or a mix.
Q. What Is Average View Duration on YouTube?
It is the average amount of time watched per relevant view. YouTube average view duration becomes more useful when compared with percentage viewed because the same average watch duration can mean very different things on videos of different lengths.
Q. What Are Returning Viewers on YouTube?
They are viewers who watched your channel before and then returned during the selected period. They help explain repeat viewing and audience loyalty alongside discovery from new viewers.
Q. What Are Regular Viewers on YouTube?
They are viewers who have watched your channel consistently over a longer period. YouTube currently defines regular viewers as viewers who watched at least once per month for more than six months during the previous year.
Q. How to Read YouTube Analytics for Beginners?
Start with a few connected metrics rather than trying to understand every report at once. Check whether people are seeing your content through impressions or Shorts feed exposure, whether they choose to watch, how long they stay, where they found the video, and whether they return later. This makes how to read YouTube Analytics for beginners much easier because each metric explains a different stage of viewer behaviour.


One Comment